

Office data analysis consulting
The office is being reborn with data.
Get unprecedented confidence and confidence in your office improvements.
Visualize how the office is used and the status of employees through data.
By analyzing with a professional eye, we can provide you with evidence-based office improvements.

Do you have any of these issues with your office or working style?
- Not sure where to start when it comes to improving your office?
- Want to measure and visualize the effects of office relocation and renovation?
- Although we have implemented hot desking, the operation is not going well.
- We want to improve the lack of conference rooms through operational improvements.
- I want to attach evidence when proposing or reporting office improvements to management.
The office is full of data.
Based on this idea, we thoroughly analyze the situation and continue to improve it.
The offices where employees work every day are filled with countless data. For example, data includes the locations employees frequently use, the conference rooms that are most commonly used, employees' motivation and health, and even the office layout. Itoki focuses on these data and thinks that by appropriately combining each data, it can support customers in improving their offices and working styles in ways that are "best for them" rather than just "generally good ways." This is "office data analysis consulting."
Examples of major data that can be measured in the office
Space usage and location data
Data is collected daily on where employees are currently located and which spaces and seats are easy or difficult to use. This highlights areas for improvement, such as changing seating arrangements and spaces. Privacy can also be respected by treating personal information as data without linking it to other information.
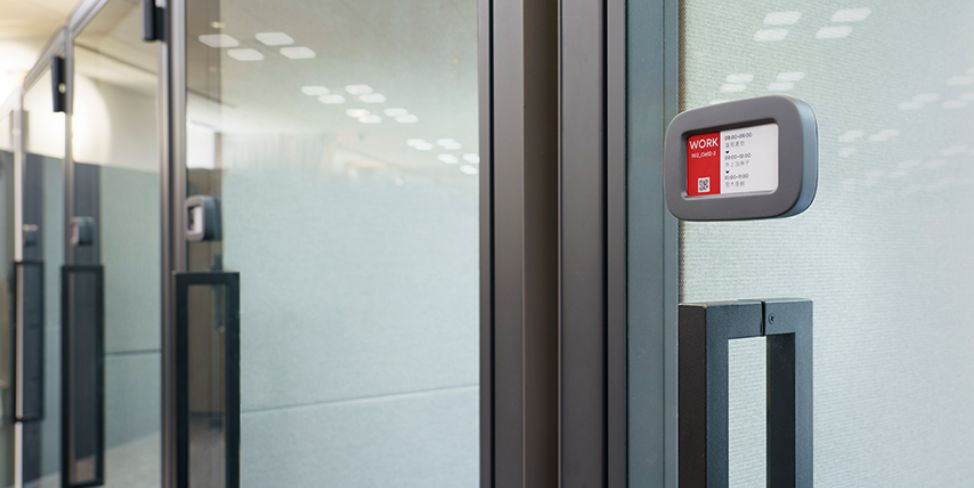
[Location management/seat reservation IoT tool]
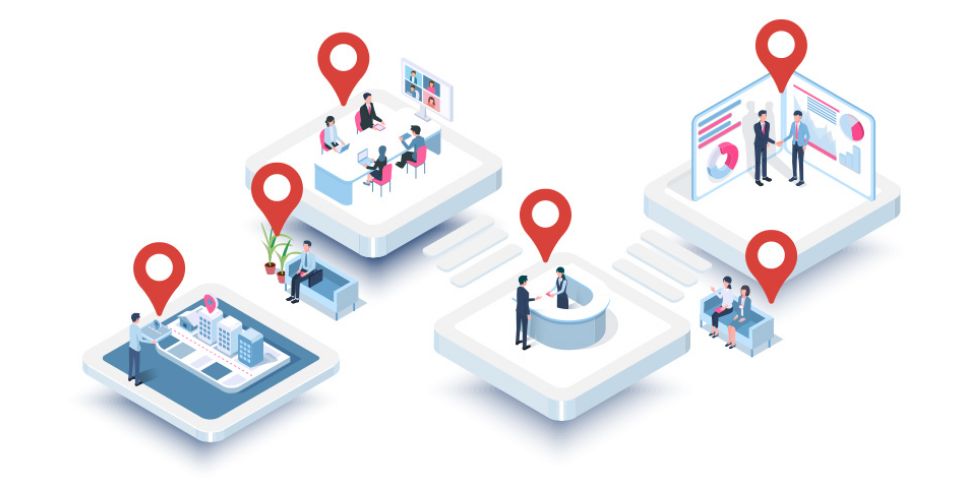
Meeting room reservation and usage data
The conference room is always full... We analyze such a situation one step further and read the actual situation such as whether there is a shortage, what time it is being used and for what purpose from objective data. This leads to essential improvements such as exploring other places that can be covered. It can also be used to update operation rules, realizing more comfortable conference room operation.
【会議室予約システム】
Employee productivity and performance data
By conducting a questionnaire survey of employees, scores are generated to see if there are any concerns about the condition of individuals and the organization, and whether employees are fully demonstrating their original abilities. The results can be used for organizational management and improvement. The data obtained can be compared with back data from public institutions, and rational improvements can be made by confirming the objective condition.
【組織と個人のコンディション可視化サービス】
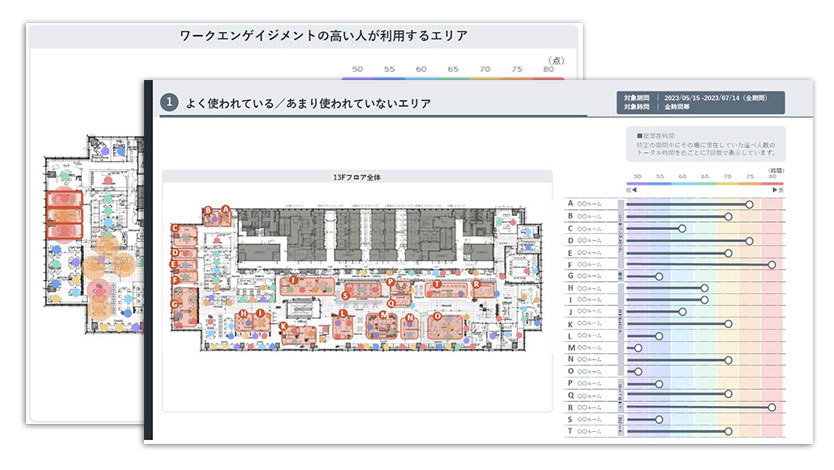
Office layout data
By interpreting the physical layout data of the office, such as what is arranged in what shape and where, in conjunction with various other data, we can provide clear suggestions on what improvements should be made and how.
The key point is that the areas that need improvement can be shown along with specific "locations," making it much easier to grasp the image.
たとえばオフィスのリニューアル時に、
データがあればこんな効果が
たとえばどの会議室がどのくらい使われているかを分析することで、新しいオフィスではどんな会議室をいくつ設けるべきかがわかります。さらに、リニューアル後の効果測定も明確に可視化でき、従業員へ「なぜ改修したか」を説明したり、経営層への報告時のエビデンスにも活用可能。また人的資本開示において明記できるようになるなど、さまざまな効果につながります。
何をどう変えればいいかがわかる
会議室や休憩室などの稼働状況を分析することで、必要なスペースが明確に。

改善効果をはっきりと可視化
改善前と改善後、それぞれのデータを比較することで改善効果をはっきりと可視化。
従業員に合理的な説明ができる
こうだったからこうした、という根拠のある説明ができることで、従業員の新オフィスへの納得感が向上。

経営層への報告や人的資本開示に
合理的なデータは経営層への報告にも高い説得力を発揮。人的資本開示にも記載しやすく、幅広い活用が可能。
Three key features of ITOKI's support
 従業員の負担は限りなく軽減。
スムーズに始めるデータ活用
「データを採る」といっても、従業員はいつも通り自然に過ごすだけ。たとえば位置情報なら、3cm角の小さなタグを社員証につけるなどして持ち歩くだけでデータの取得が可能。従業員の負担感なく手軽に、スムーズに運用できることが大きな魅力です。

 得られたデータは、プロならではの知見で
徹底的に解析
得られたデータは、イトーキのスペシャリストが分析。これまで多くのオフィスを手がけてきた経験を生かし、プロの知見を駆使して解析します。何気ないデータの影に隠れた改善のカギを見つけ出し、具体的な形として描いていきます。
 わかりやすく直感的な成果物。
合理的根拠を使いやすくご提示
解析結果とそこから見える示唆を、わかりやすい成果物としてご提示。たとえばオフィス稼働状況は直感的なビジュアルのレポートにまとめます。オフィスリニューアルの根拠として社内の稟議に添付したり、改善前・改善後の効果測定にも最適です。
Documents Download
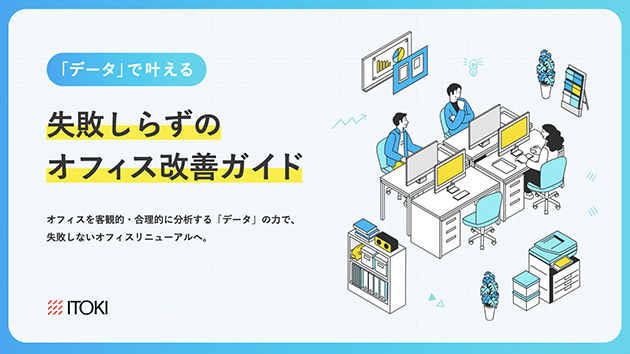
「データ」で叶える、失敗しらずのオフィス改善ガイド
オフィスリニューアルのよくある失敗から、そこに大きな効果をもたらすデータ収集と解析方法、さらに改善事例までをまとめた必見の一冊です。