
News room



[National Office workers Awareness Survey 2026] Approximately 1 in 3 people in their 20s feel lonely at work.
The gap between those who want to continue working and those who don't, based on workplace experience evaluations, is approximately 6.5 times.
Itoki Central Research Institute conducted a survey of 4,650 full-time employees across eight regions nationwide to investigate working styles and workplace experiences by region and generation.
ITOKI CORPORATION (Headquarters: Chuo-ku, Tokyo; President and CEO: Koji Minato) conducted the "National Office Worker Awareness Survey 2026" through its Central Research workers, targeting 4,650 full-time employees aged 20-59 who primarily commute to the office across eight regions nationwide (Hokkaido, Tohoku, Tokyo Metropolitan Area, Kanto-Shinetsu, Chubu, Kansai, Chugoku-Shikoku, and Kyushu). As work style options expand and the way people commute to the office is re-evaluated, this survey broadly investigated the realities related to the "quality of commuting to the office," including frequency of commuting, work style, desired work environment, experiences gained at work, and intention to continue working, broken down by region and generation.
Furthermore, when analyzing intentions to continue working, intentions to recommend the workplace, and perceived productivity based on evaluations of workplace experience (ease of work, sense of growth and meaning, and connection with the organization), significant differences were observed in intentions and perceived productivity between those with high and low evaluations of their workplace experience. Differences were also observed in what employees seek in terms of work style and workplace environment, depending on region and generation.
*These survey results show correlations and trends, and do not definitively establish causal relationships.
Detailed survey results can be downloaded from the page below.
[Survey Data] Nationwide Office workers Awareness Survey 2026 [1582KB]
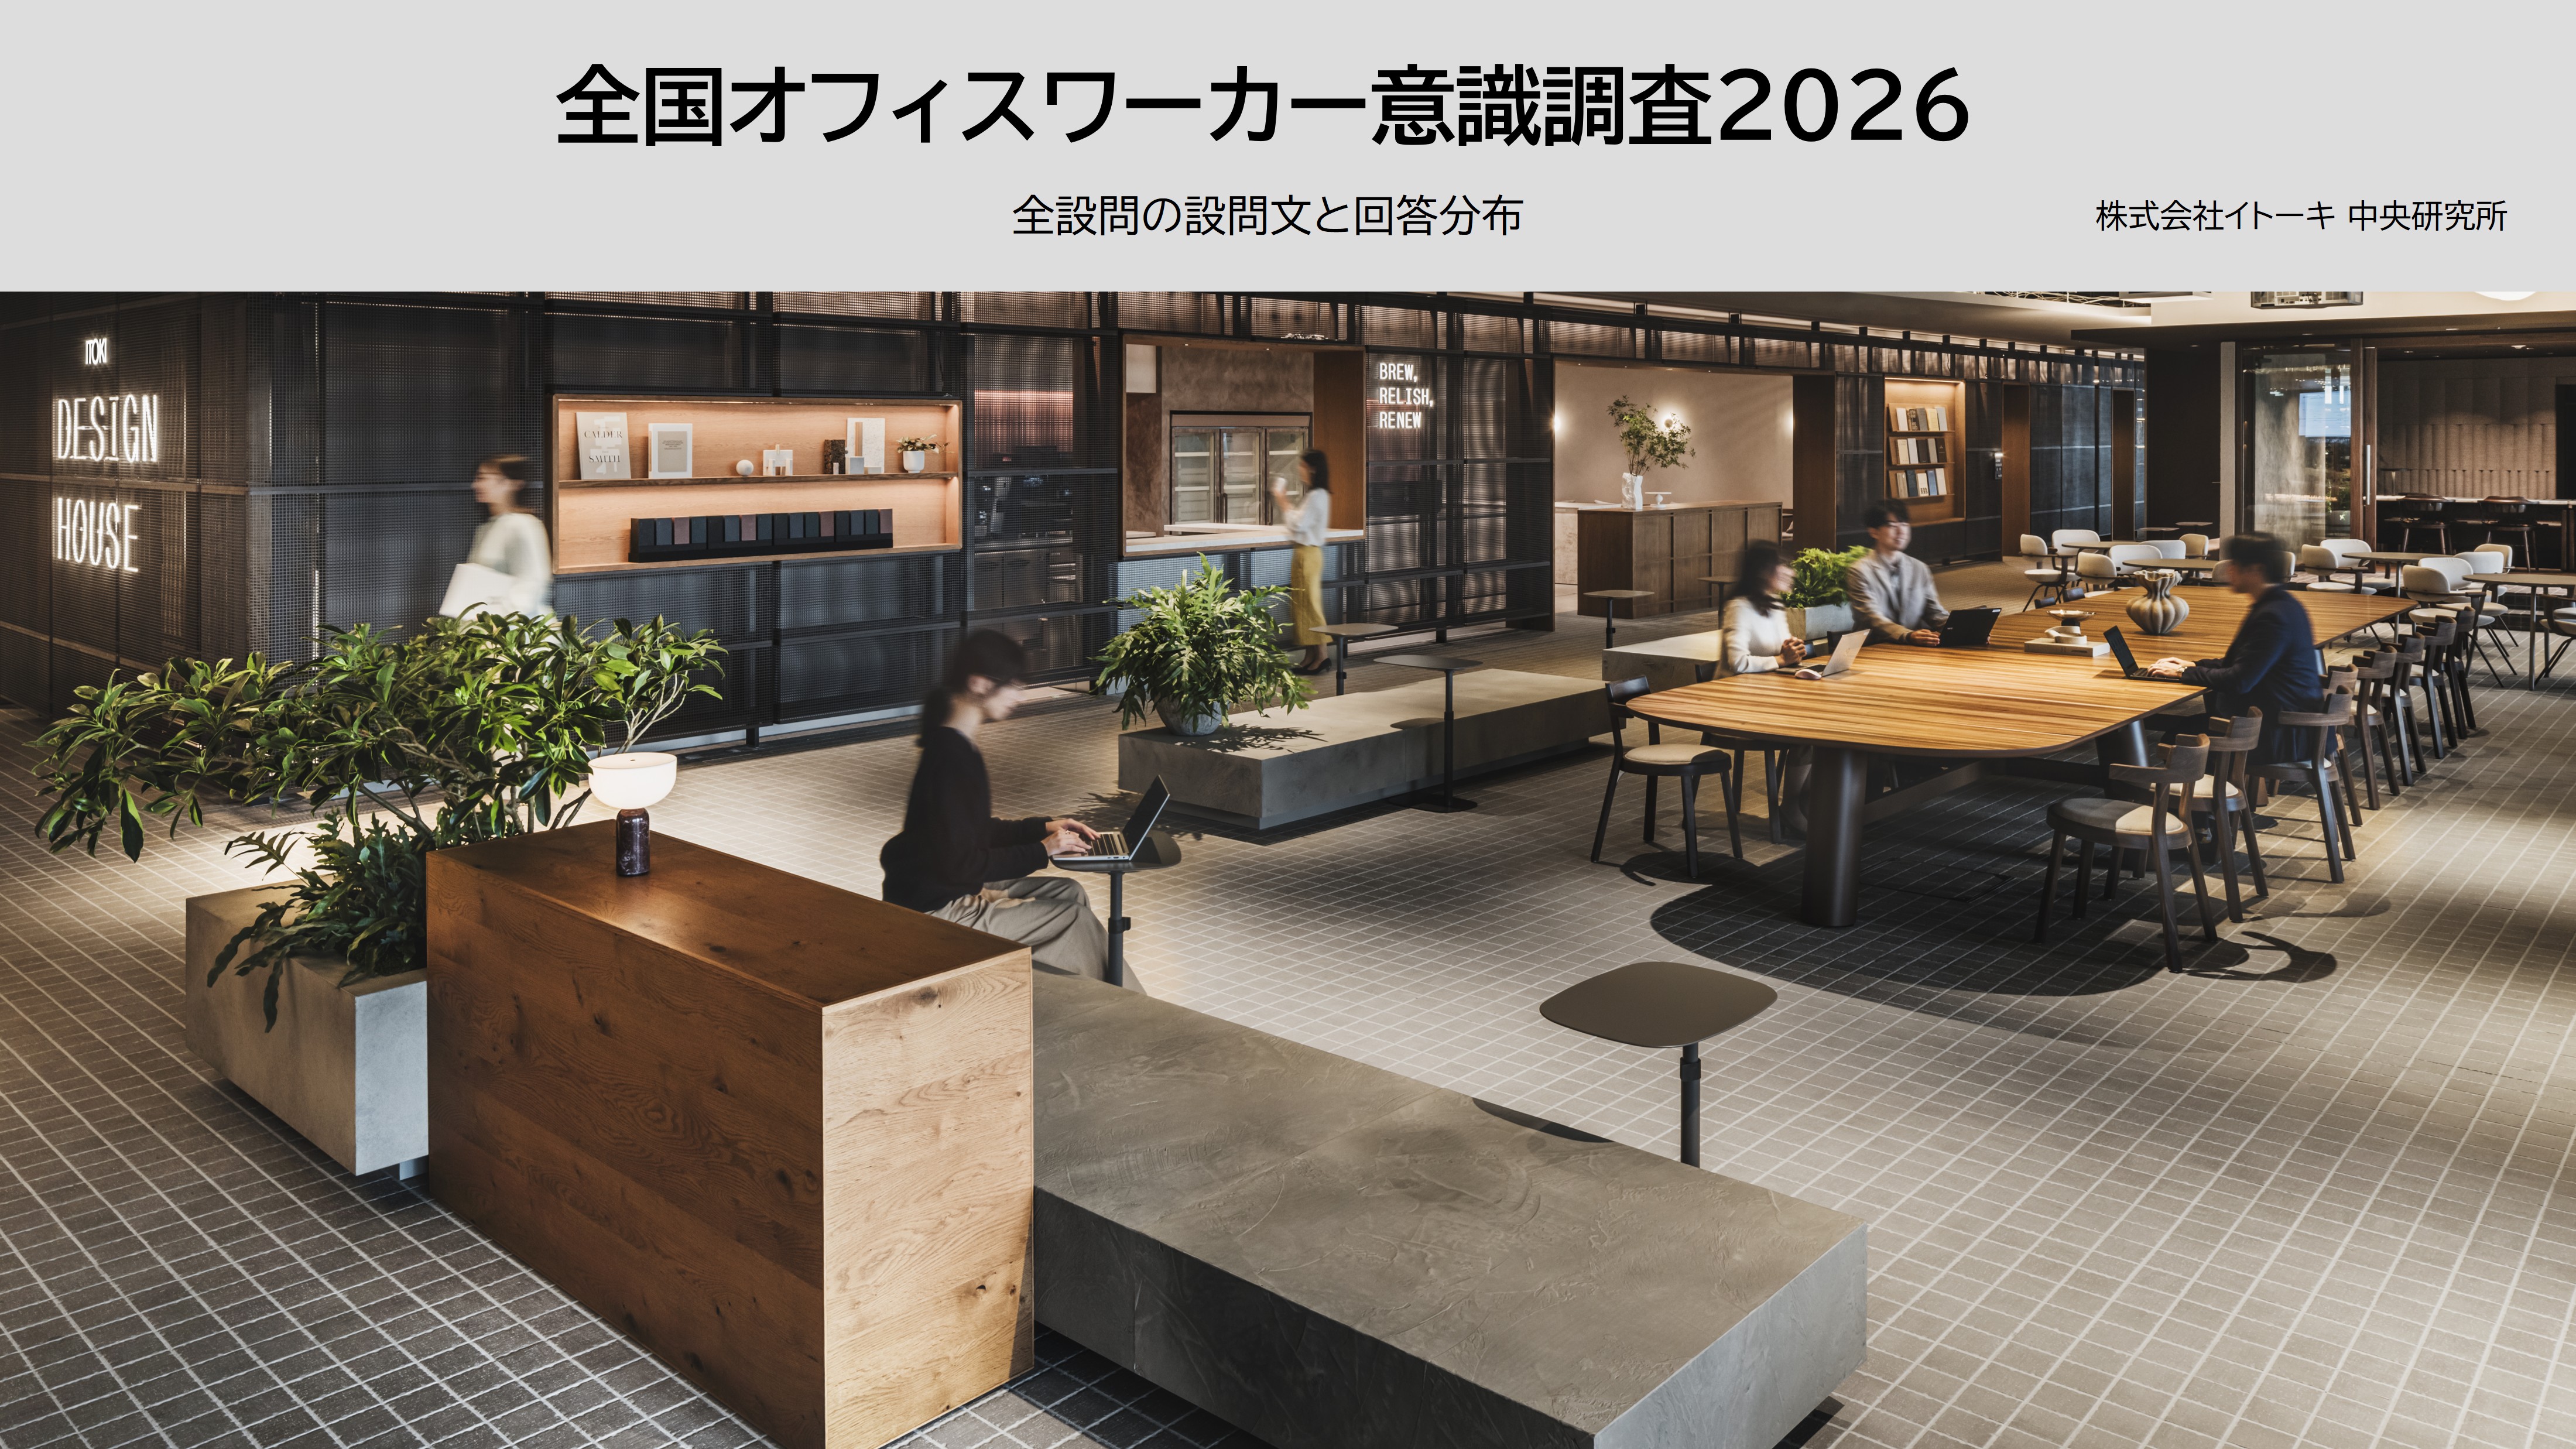
Research highlights
• [Feeling lonely despite not being isolated] Approximately 20% of people in their 20s agree with both "being able to work without feeling isolated" and "sometimes feeling lonely."
- There is a gap of approximately 6.5 times between those who want to continue working and those who don't, when comparing their sense of growth and meaning in their work.
- The number of "hybrid work arrangements centered around going to the office" in the Tokyo metropolitan area is more than twice that of the other seven regions, and "long commutes" are also the highest among the eight regions.
- Perceived productivity ranks highest in the Kansai region among 8 regions, and the meaning of work and workplace recommendations also reach the highest levels.
In Kyushu, approximately one in four people prioritize a "psychologically safe working environment," the highest percentage among the eight regions (18.8% nationwide).
The most frequently cited role expected from the office (select up to 3) was "concentration" (52.9%), followed by "consultation and collaboration" (42.4%).
[Feeling lonely despite not being isolated] About 20% of people in their 20s agree with both "being able to work without feeling isolated" and "sometimes feeling lonely."
31.3% of people in their 20s agreed that they "sometimes feel lonely." Furthermore, 19.8% of all people in their 20s agreed with both "being able to work without feeling isolated" and "sometimes feeling lonely." This figure was 7.2% for those in their 50s. It seems that feeling "able to work without feeling isolated" and not feeling lonely are not necessarily the same thing. In addition to opportunities to interact with people face-to-face, it can be a clue to how easy it is to talk to someone and how one can interact with others in the workplace.
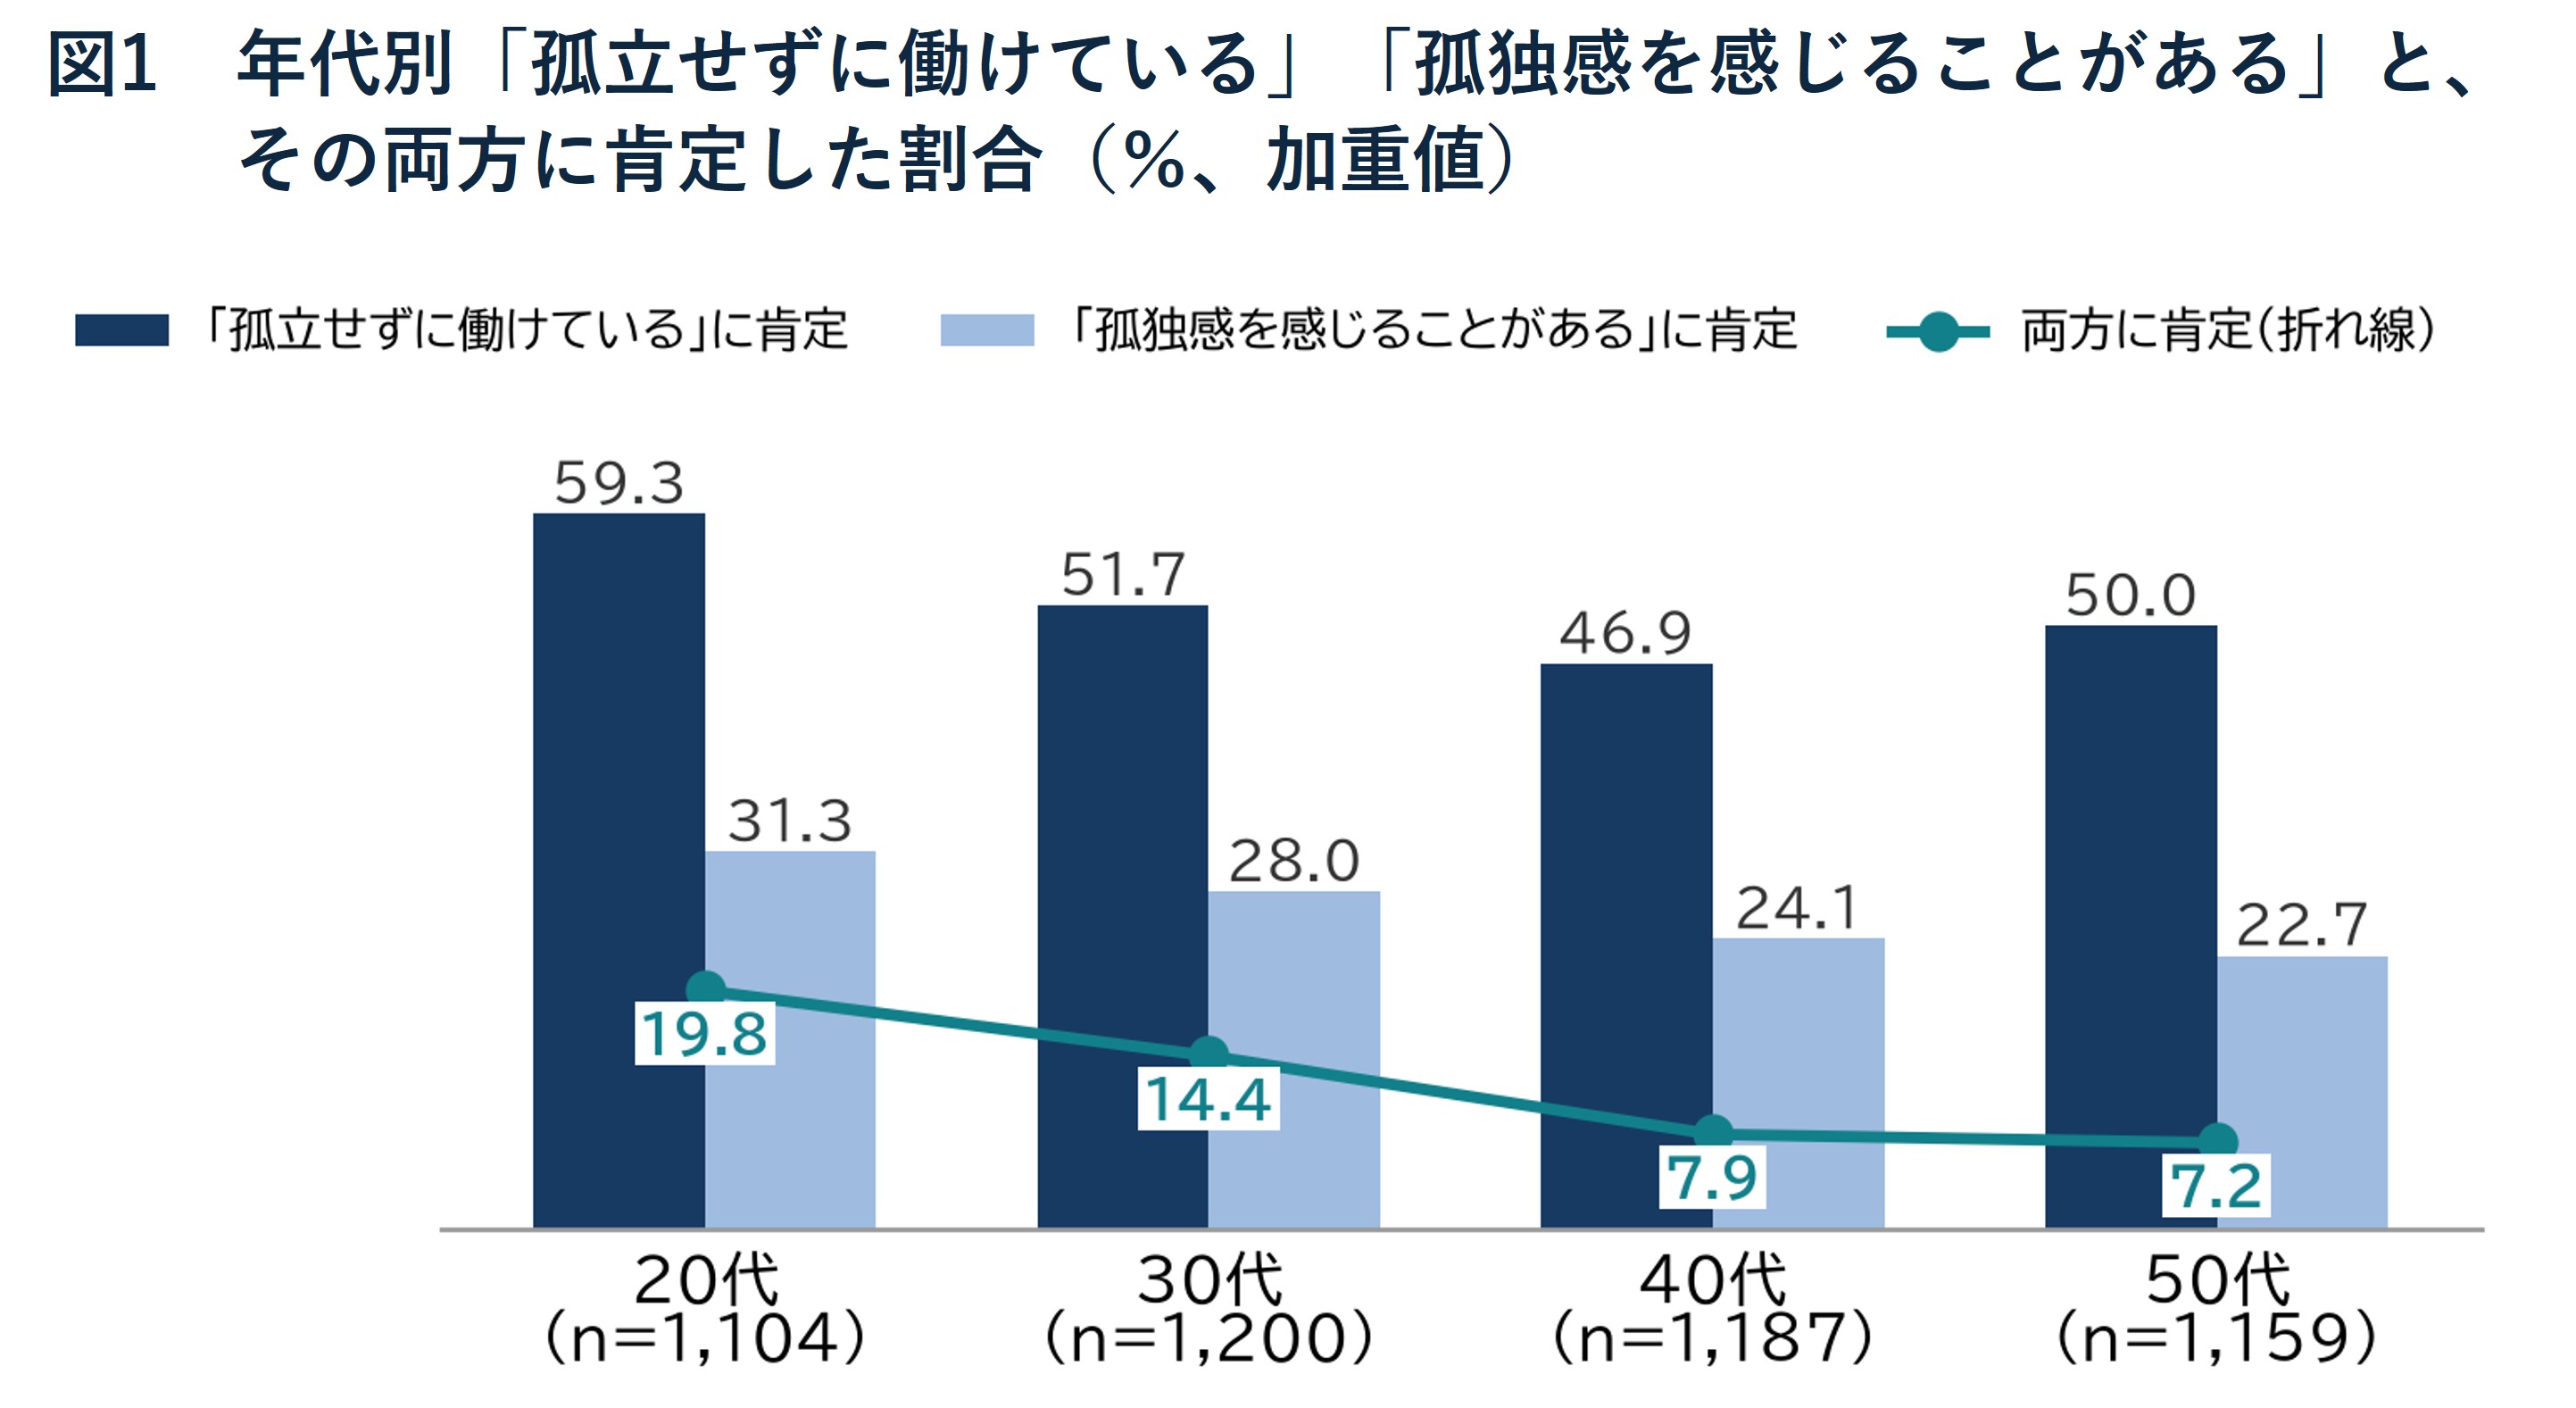
Note: All respondents (4,650 people) were compiled by age group. Affirmative = sum of "somewhat agree" and "strongly agree" on a 5-point scale. Affirmative in both (line graph) = people who affirmed both questions. The line graph is a comparison between age groups and does not show the progression over time. n is the number of respondents (before adjustment). Age differences include differences in years of service and job position. When these factors are matched up in the analysis, age differences are not statistically clear, and it cannot be said that age is the cause of loneliness.
Source: ITOKI CORPORATION "National Office workers Awareness Survey 2026"
There is a gap of approximately 6.5 times between those who want to continue working and those who feel a sense of growth and meaning in their work.
We surveyed 4,114 people who work in the office five or more days a week, examining the relationship between three aspects of their work experience—ease of work, sense of growth and meaning, and connection with the organization—and their intention to continue working.
Among those who rated "growth and sense of meaning" highly, 88.4% answered that they "want to continue working at this workplace," compared to only 13.5% among those who rated it lower, a difference of approximately 6.5 times. In the other two categories, "ease of work" was 82.3% versus 18.1%, and "connection with the organization" was 83.0% versus 17.5%, showing differences of more than four times.
Furthermore, looking at the workplace conditions behind this difference, among the 10 items related to the workplace environment and work methods, the biggest difference in workplace experience scores between high-scoring and low-scoring individuals was in "decision-making at an appropriate speed" (3.79 points / 2.54 points) and "support from superiors" (3.76 points / 2.60 points). It seems necessary to consider both the workplace and the systems in place for carrying out work there.
*This comparison shows the relationship between work experience and intention to continue working, and does not indicate that work experience changed intentions.
*The work experience scores are calculated by assigning points from 5 for "strongly agree" to 1 for "strongly disagree" for each of the three work experience activities (11 items as noted in Figure 2), and then averaging the average scores for each activity (out of 5 points). Those with high scores are those who answered "somewhat agree" or "strongly agree" to the items, while those with low scores are those who answered "somewhat disagree" or "strongly disagree."
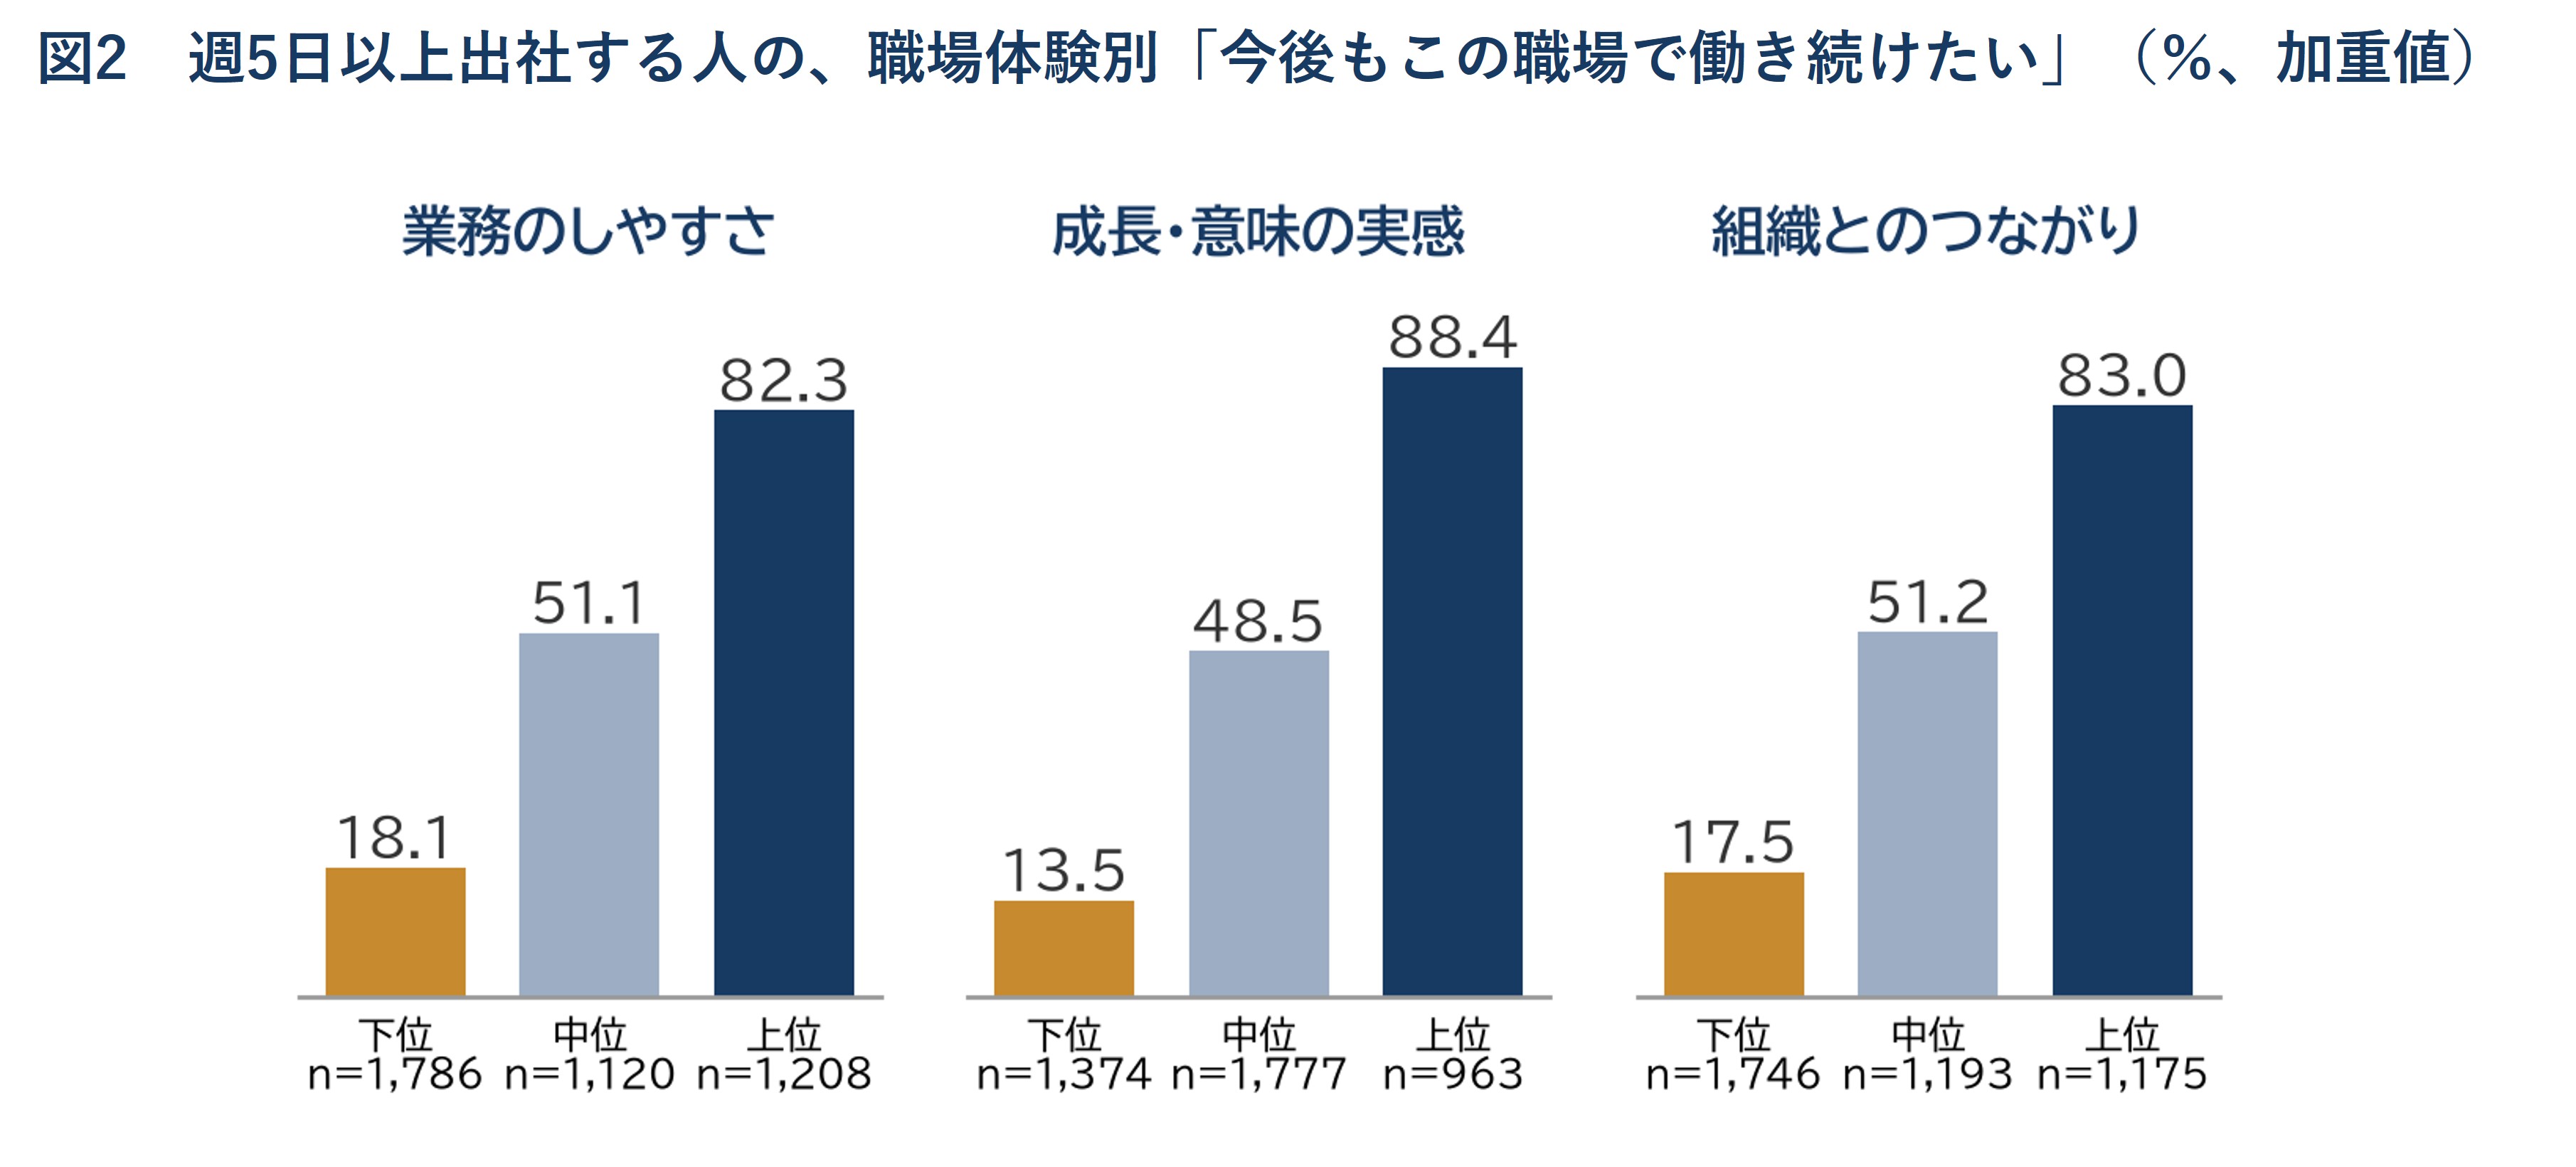
Note: This survey targeted 4,114 people who commute to the office five or more days a week. Ease of work = easy to concentrate, easy to communicate with necessary people, easy to obtain necessary information, easy to proceed with work smoothly (4 items), sense of growth and meaning = easy to feel the meaning and value of work, learning and gaining insights, feeling that you are growing (3 items), connection with the organization = easy to interact with those around you, working as a member of the organization or team, easy to collaborate with other departments, working without isolation (4 items). Lower, middle, and upper = divisions created by dividing all respondents (4,650 people) into three equal parts from lowest to highest based on the average score of each axis (the number of people is not even due to many ties). Affirmative = sum of "somewhat agree" and "strongly agree". Those who did not affirm include those who answered "neither agree nor disagree" and do not indicate an intention to leave the company. This survey targeted people who spend 70% or more of their time working in the office (86.5% commute to the office five or more days a week) and is not a comparison with people who work primarily remotely. n is the number of respondents (before adjustment). This is a correlation based on a survey conducted at a single point in time and does not demonstrate a causal relationship.
Source: ITOKI CORPORATION "National Office workers Awareness Survey 2026"
The number of "hybrid work arrangements centered around going to the office" in the Tokyo metropolitan area is more than twice that of the other seven regions, and "long commutes" are also the highest among the eight regions.
In the Tokyo metropolitan area, 20.0% of people work a hybrid work style, primarily commuting to the office, higher than the 4.8-9.7% in the other seven regions. Furthermore, 35.8% of people in the Tokyo metropolitan area commute for 60 minutes or more each way, higher than the national average of 22.0%.
On the other hand, the percentage of people who prioritize a "commutable environment" was similar across the Tokyo metropolitan area (44.0%), Kansai (42.9%), and the other six regions (40.6%). While there were regional differences in commuting time, the difference in the percentage of people who prioritize a "commutable environment" was only 3.4 percentage points.
*The Greater Tokyo Area is defined in this survey by work location and refers to Saitama Prefecture, Tokyo, Kanagawa Prefecture, and Yamanashi Prefecture. Chiba Prefecture is included in the Kanto-Shinetsu region.
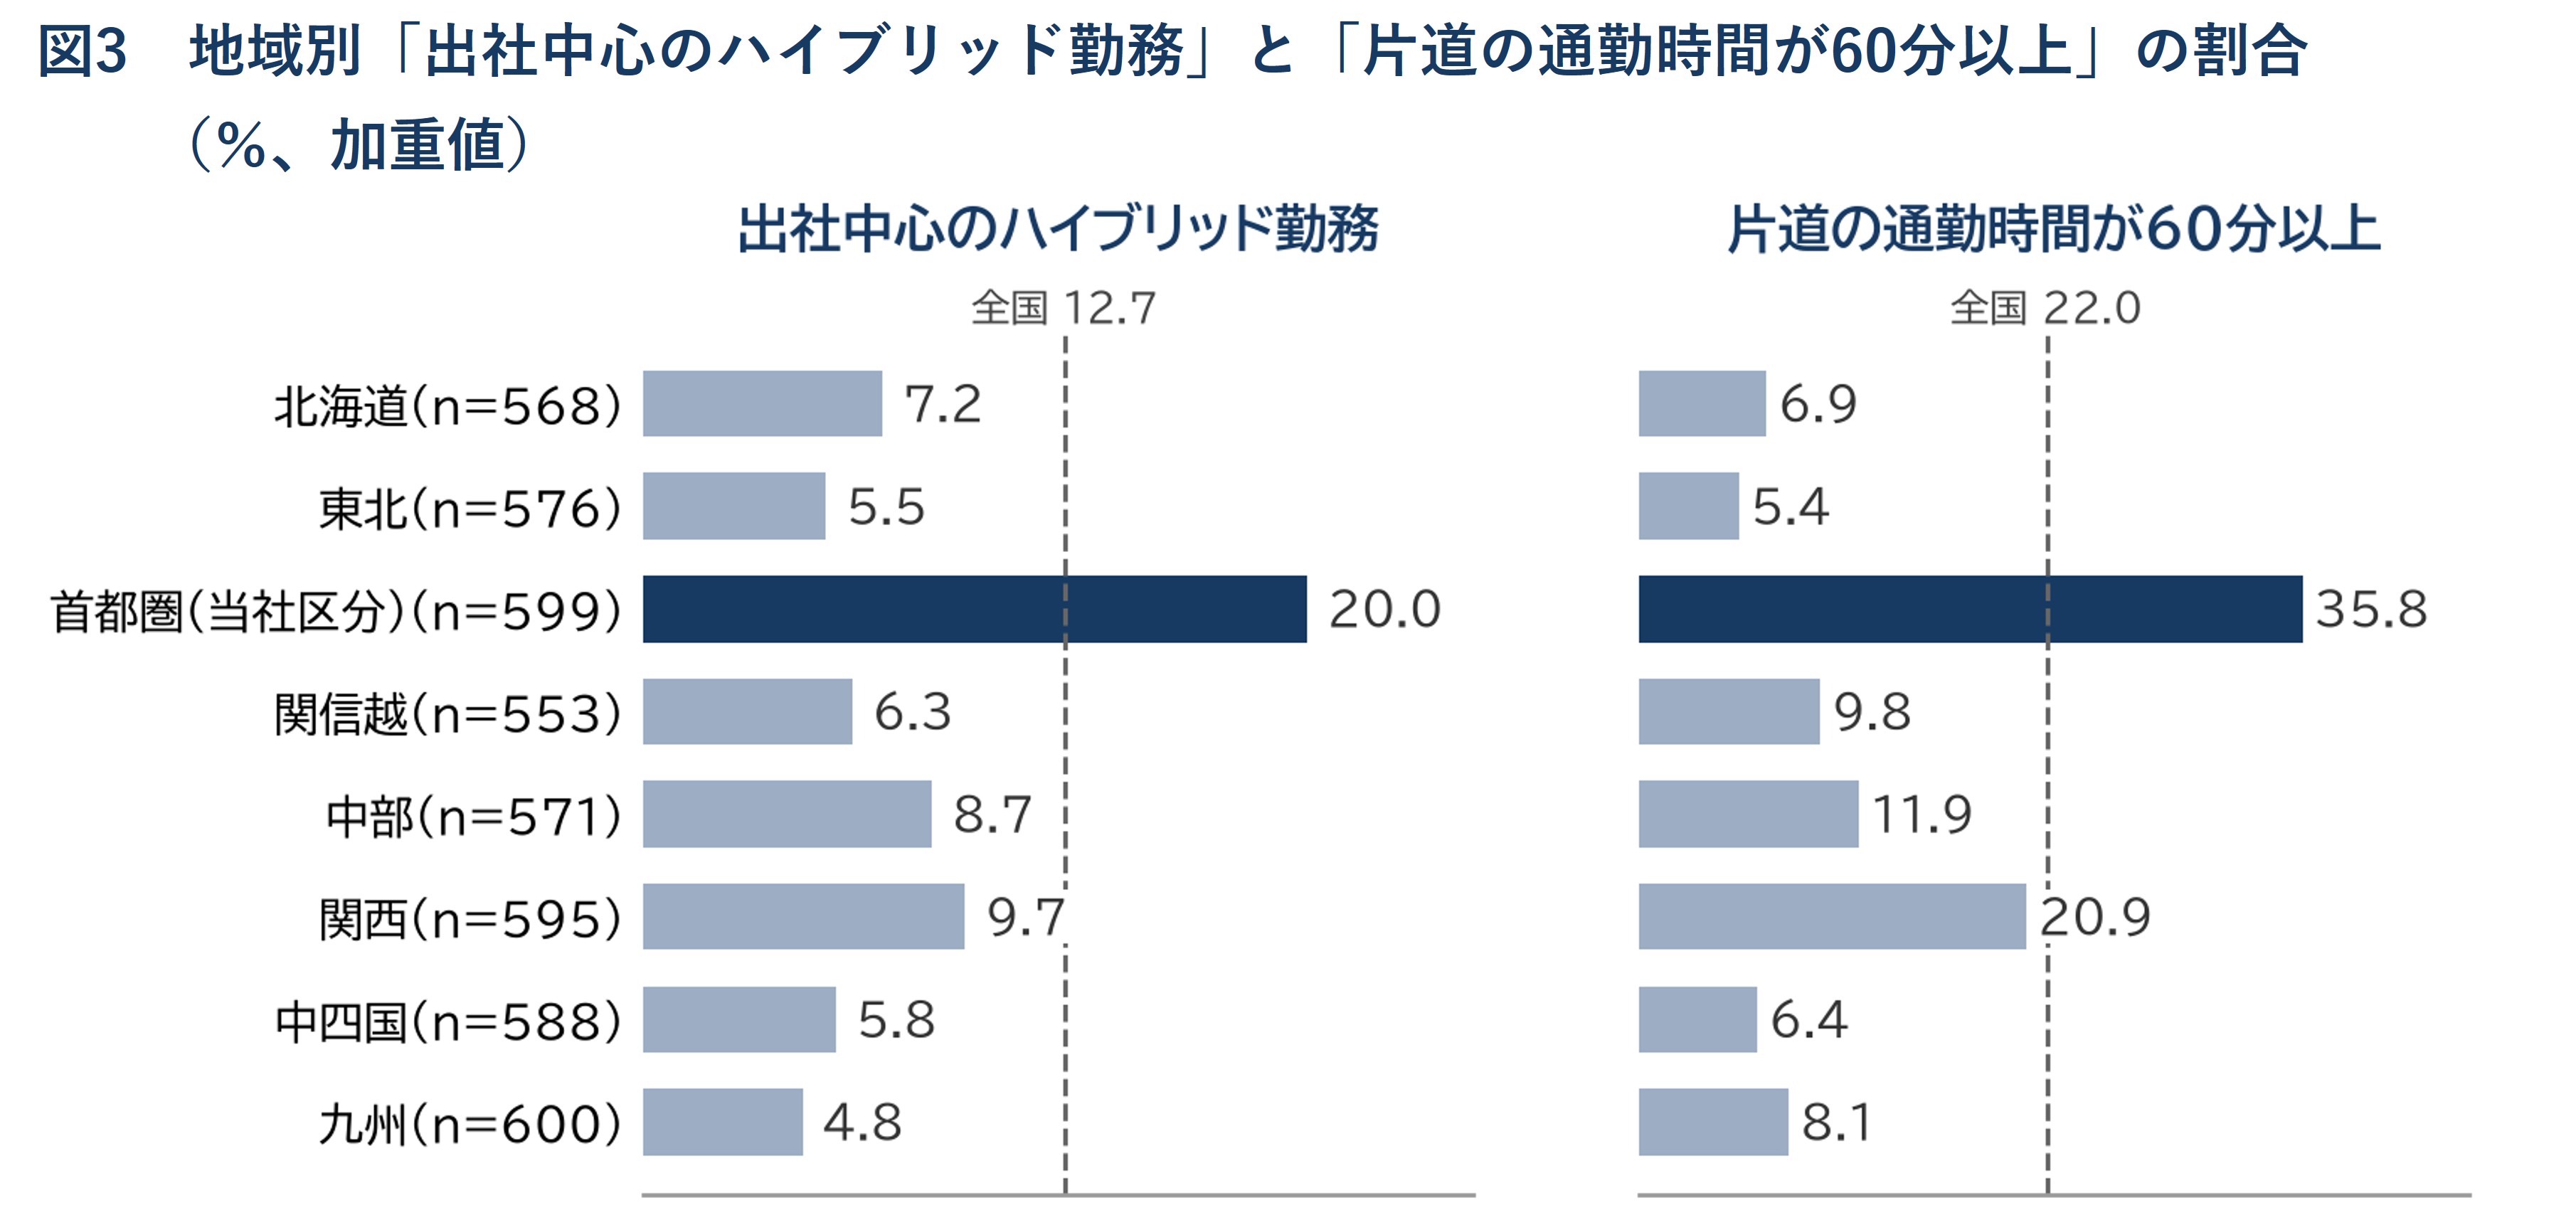
Note: Work style refers to those who chose "primarily in-office hybrid" as the basic work style system of their primary workplace. Commuting time is the one-way trip on a normal in-office day. The dashed line represents the entire country (4,650 people). The region is divided into 8 categories based on the workplace in this survey. n is the number of respondents (before adjustment).
Source: ITOKI CORPORATION "National Office workers Awareness Survey 2026"
The Kansai region ranked first in productivity perception among eight regions, and also achieved the highest scores for meaning in work and workplace recommendations.
In the Kansai region, 44.1% of respondents agreed that they were working productively, compared to 37.9% nationwide. In Kansai, 45.1% (38.8% nationwide) also agreed that they felt it was easy to find meaning and value in their work, and 30.8% (26.8% nationwide) agreed that they would recommend their company's office and work style to others, indicating that multiple perceptions are aligned in the same direction.
This result provides an opportunity to consider what people working in the Kansai region are gaining from their workplaces. However, what was measured here was the individual's perception and intention, and it does not compare actual performance or productivity across regions.
*Each region has approximately 550-600 responses. The difference between Kansai and the other seven regions in the percentage of people who "work productively" was statistically significant, even after adjusting for age, gender, company size, industry, and job position.
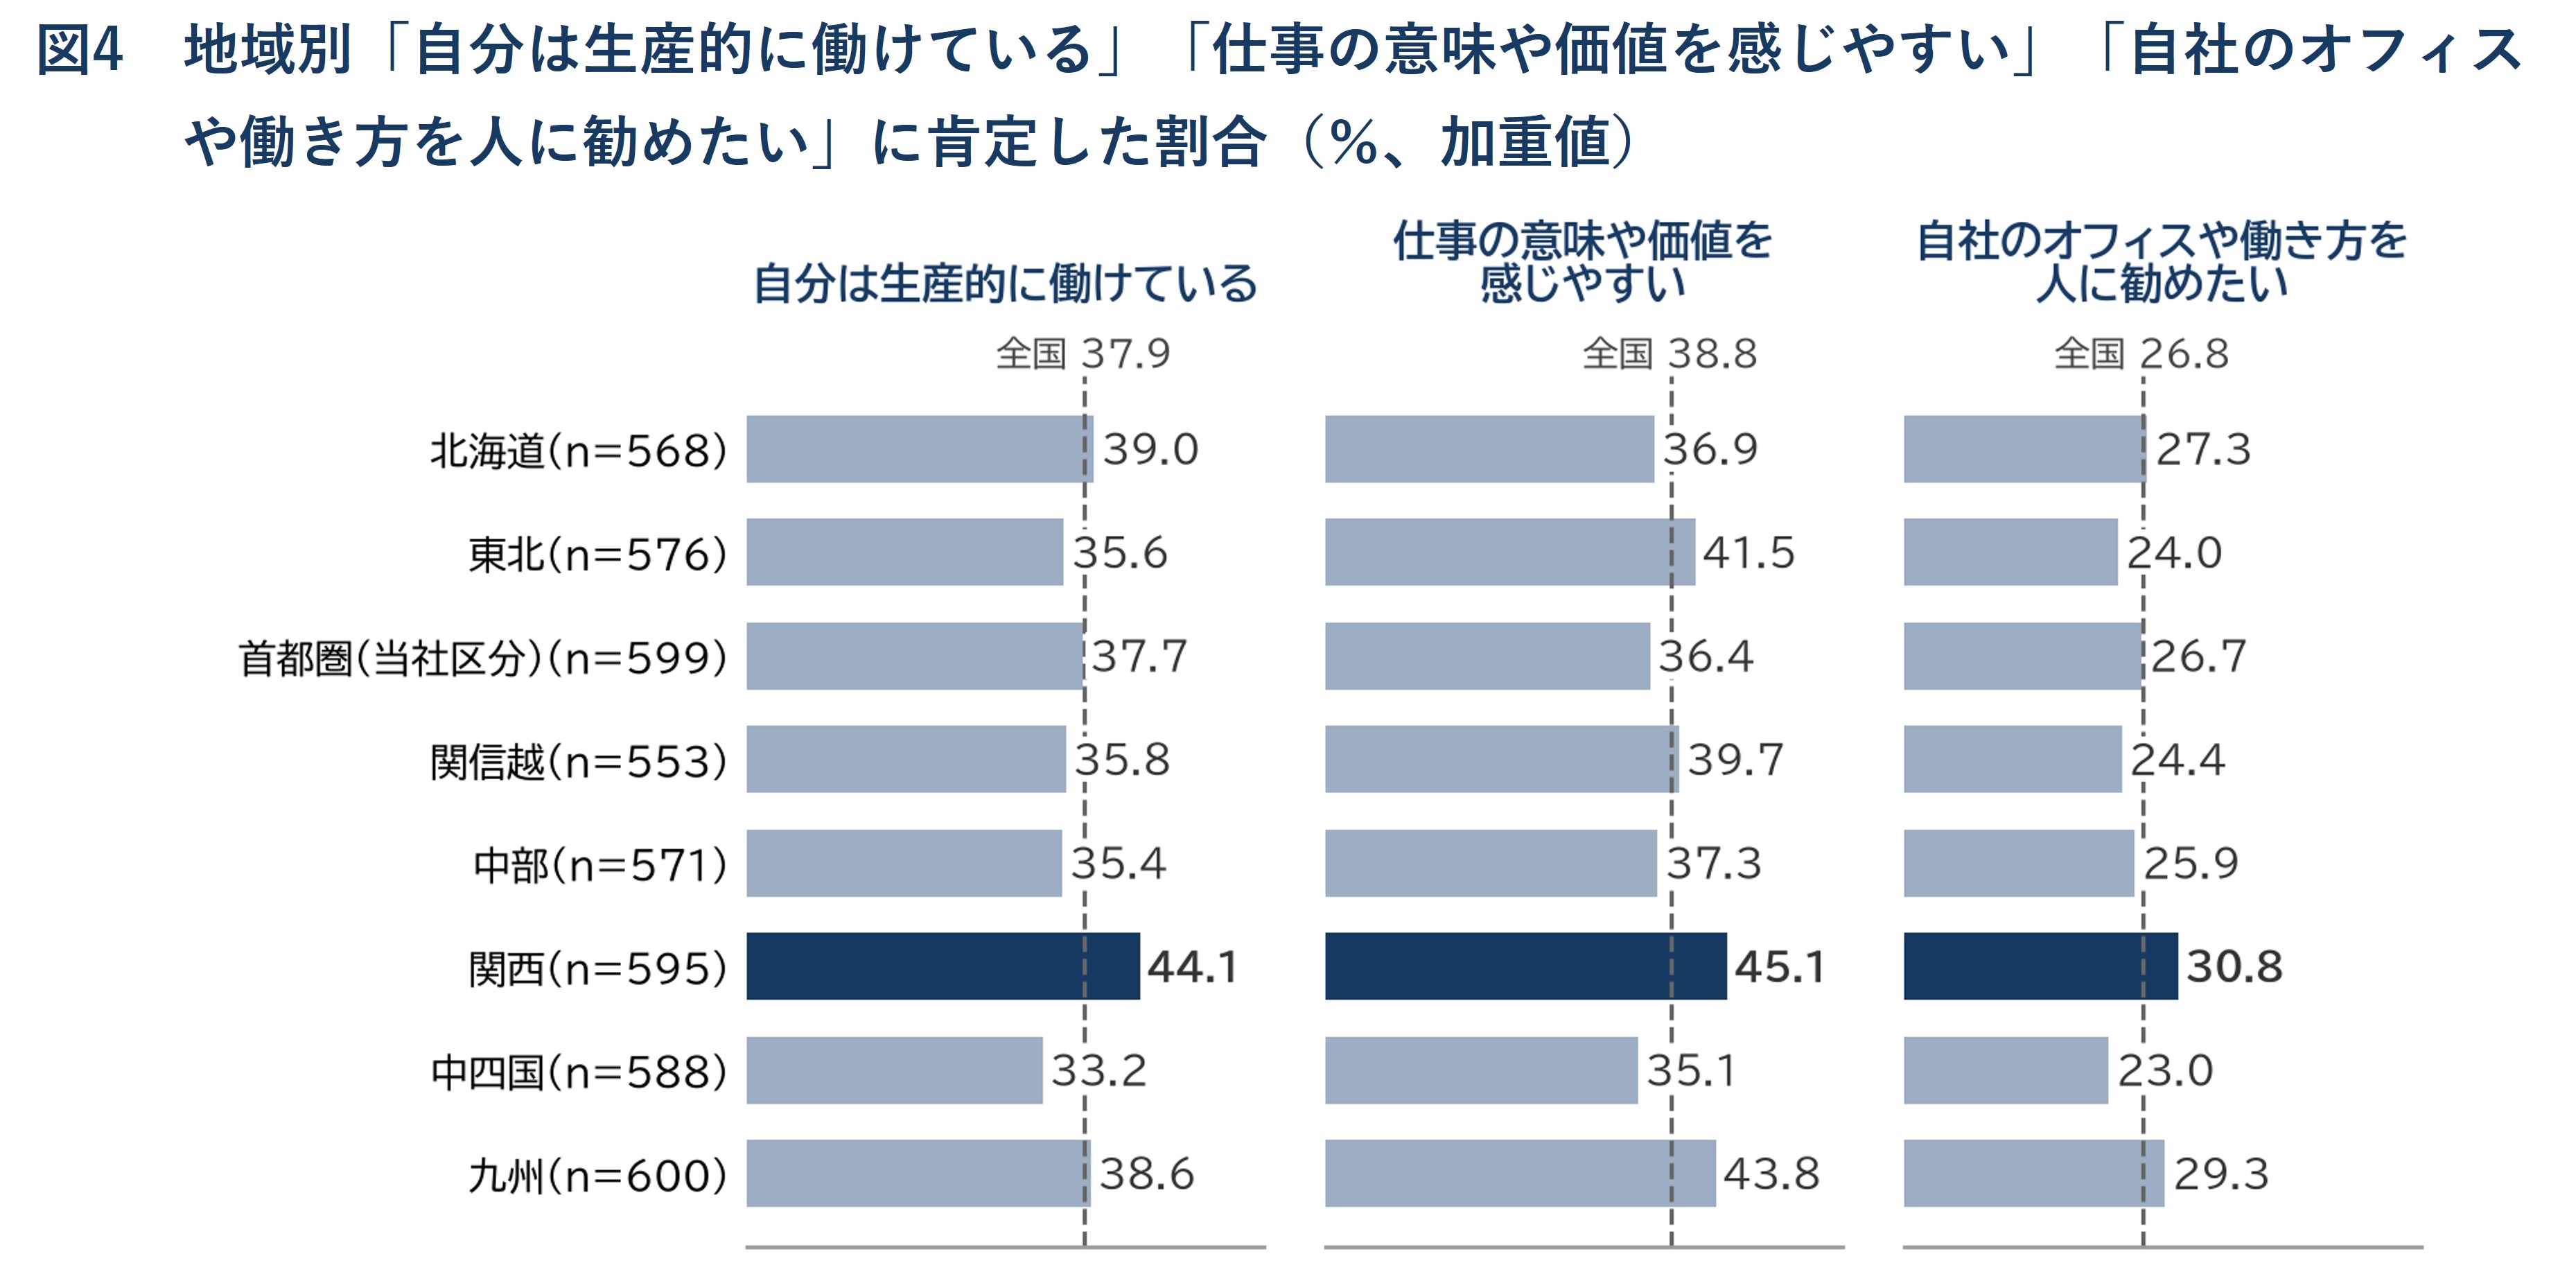
Note: Affirmative = total of "somewhat agree" and "strongly agree" on a 5-point scale. The dashed line represents the entire country (4,650 people). The region is divided into 8 categories based on the workplace in this survey. This represents the individual's feelings and intentions, and does not compare performance or productivity. n is the number of respondents (before adjustment).
Source: ITOKI CORPORATION "National Office workers Awareness Survey 2026"
In Kyushu, approximately one in four people prioritize a "psychologically safe working environment," the highest percentage among the eight regions (18.8% nationwide).
When asked to choose only one type of workplace environment they would like to work in in the future, 24.9% of people in Kyushu and 18.8% nationwide prioritized "a psychologically safe and secure working environment." This figure also exceeded 20% in Tohoku (22.8%) and Chugoku/Shikoku (22.0%).
Nationwide, 62.0% of those who selected "a psychologically secure work environment" when asked to list up to three important factors also chose it as their most important factor. This suggests that it is a high-priority condition for those who selected it. This is a result of asking about the conditions desired in a future workplace, and does not represent an evaluation of the sense of security in current workplaces by region.
*Each region has approximately 550-600 responses. The difference between Kyushu and the other seven regions was statistically significant even after adjusting for age, gender, company size, industry, and job title.
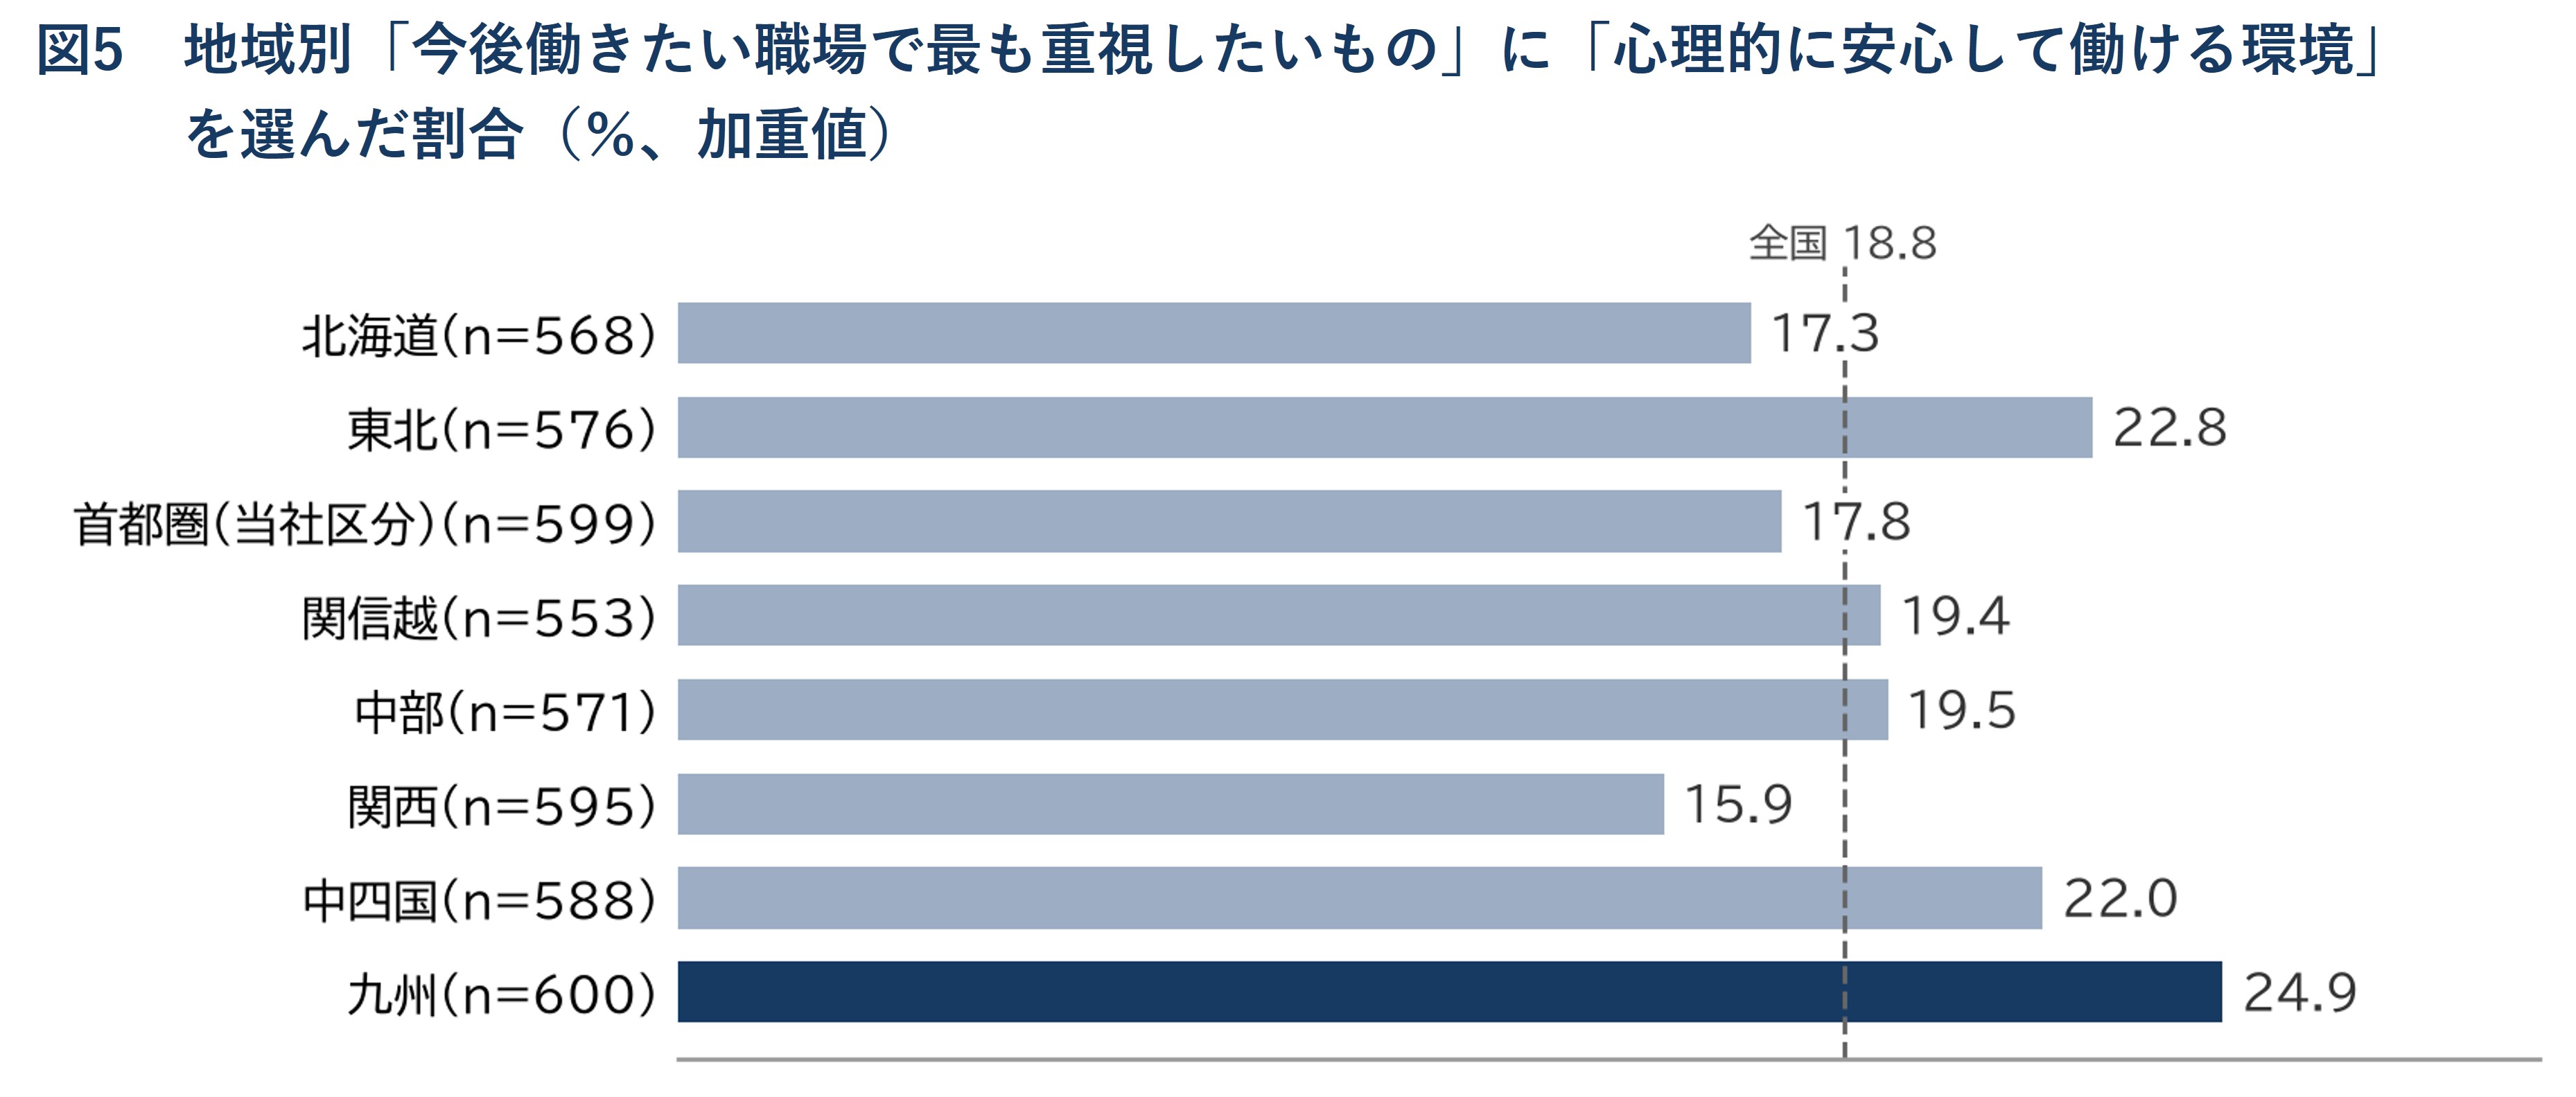
Note: This question requires only one selection. The dashed line represents the entire country (4,650 people). This is the result of asking about the conditions desired in future workplaces, and does not represent an evaluation of the sense of security in the current workplace. n is the number of respondents (before correction).
Source: ITOKI CORPORATION "National Office workers Awareness Survey 2026"
The most frequently cited role expected from the office (up to three choices) was "concentration" (52.9%), followed by "consultation and collaboration" (42.4%).
When asked to select up to three roles they expect the office to play in the future, the most common answer was "a place to concentrate on work" at 52.9%, followed by "a place to consult and collaborate with colleagues and superiors" at 42.4%. In another question, when asked to select up to three workplace environments they would like to work in in the future, 49.5% chose "an environment that makes it easy to concentrate on work."
Offices are expected to be both a place where people gather and a place where individuals can work independently. It's important to have both a place to concentrate and a place to consult with others when needed, depending on the task.
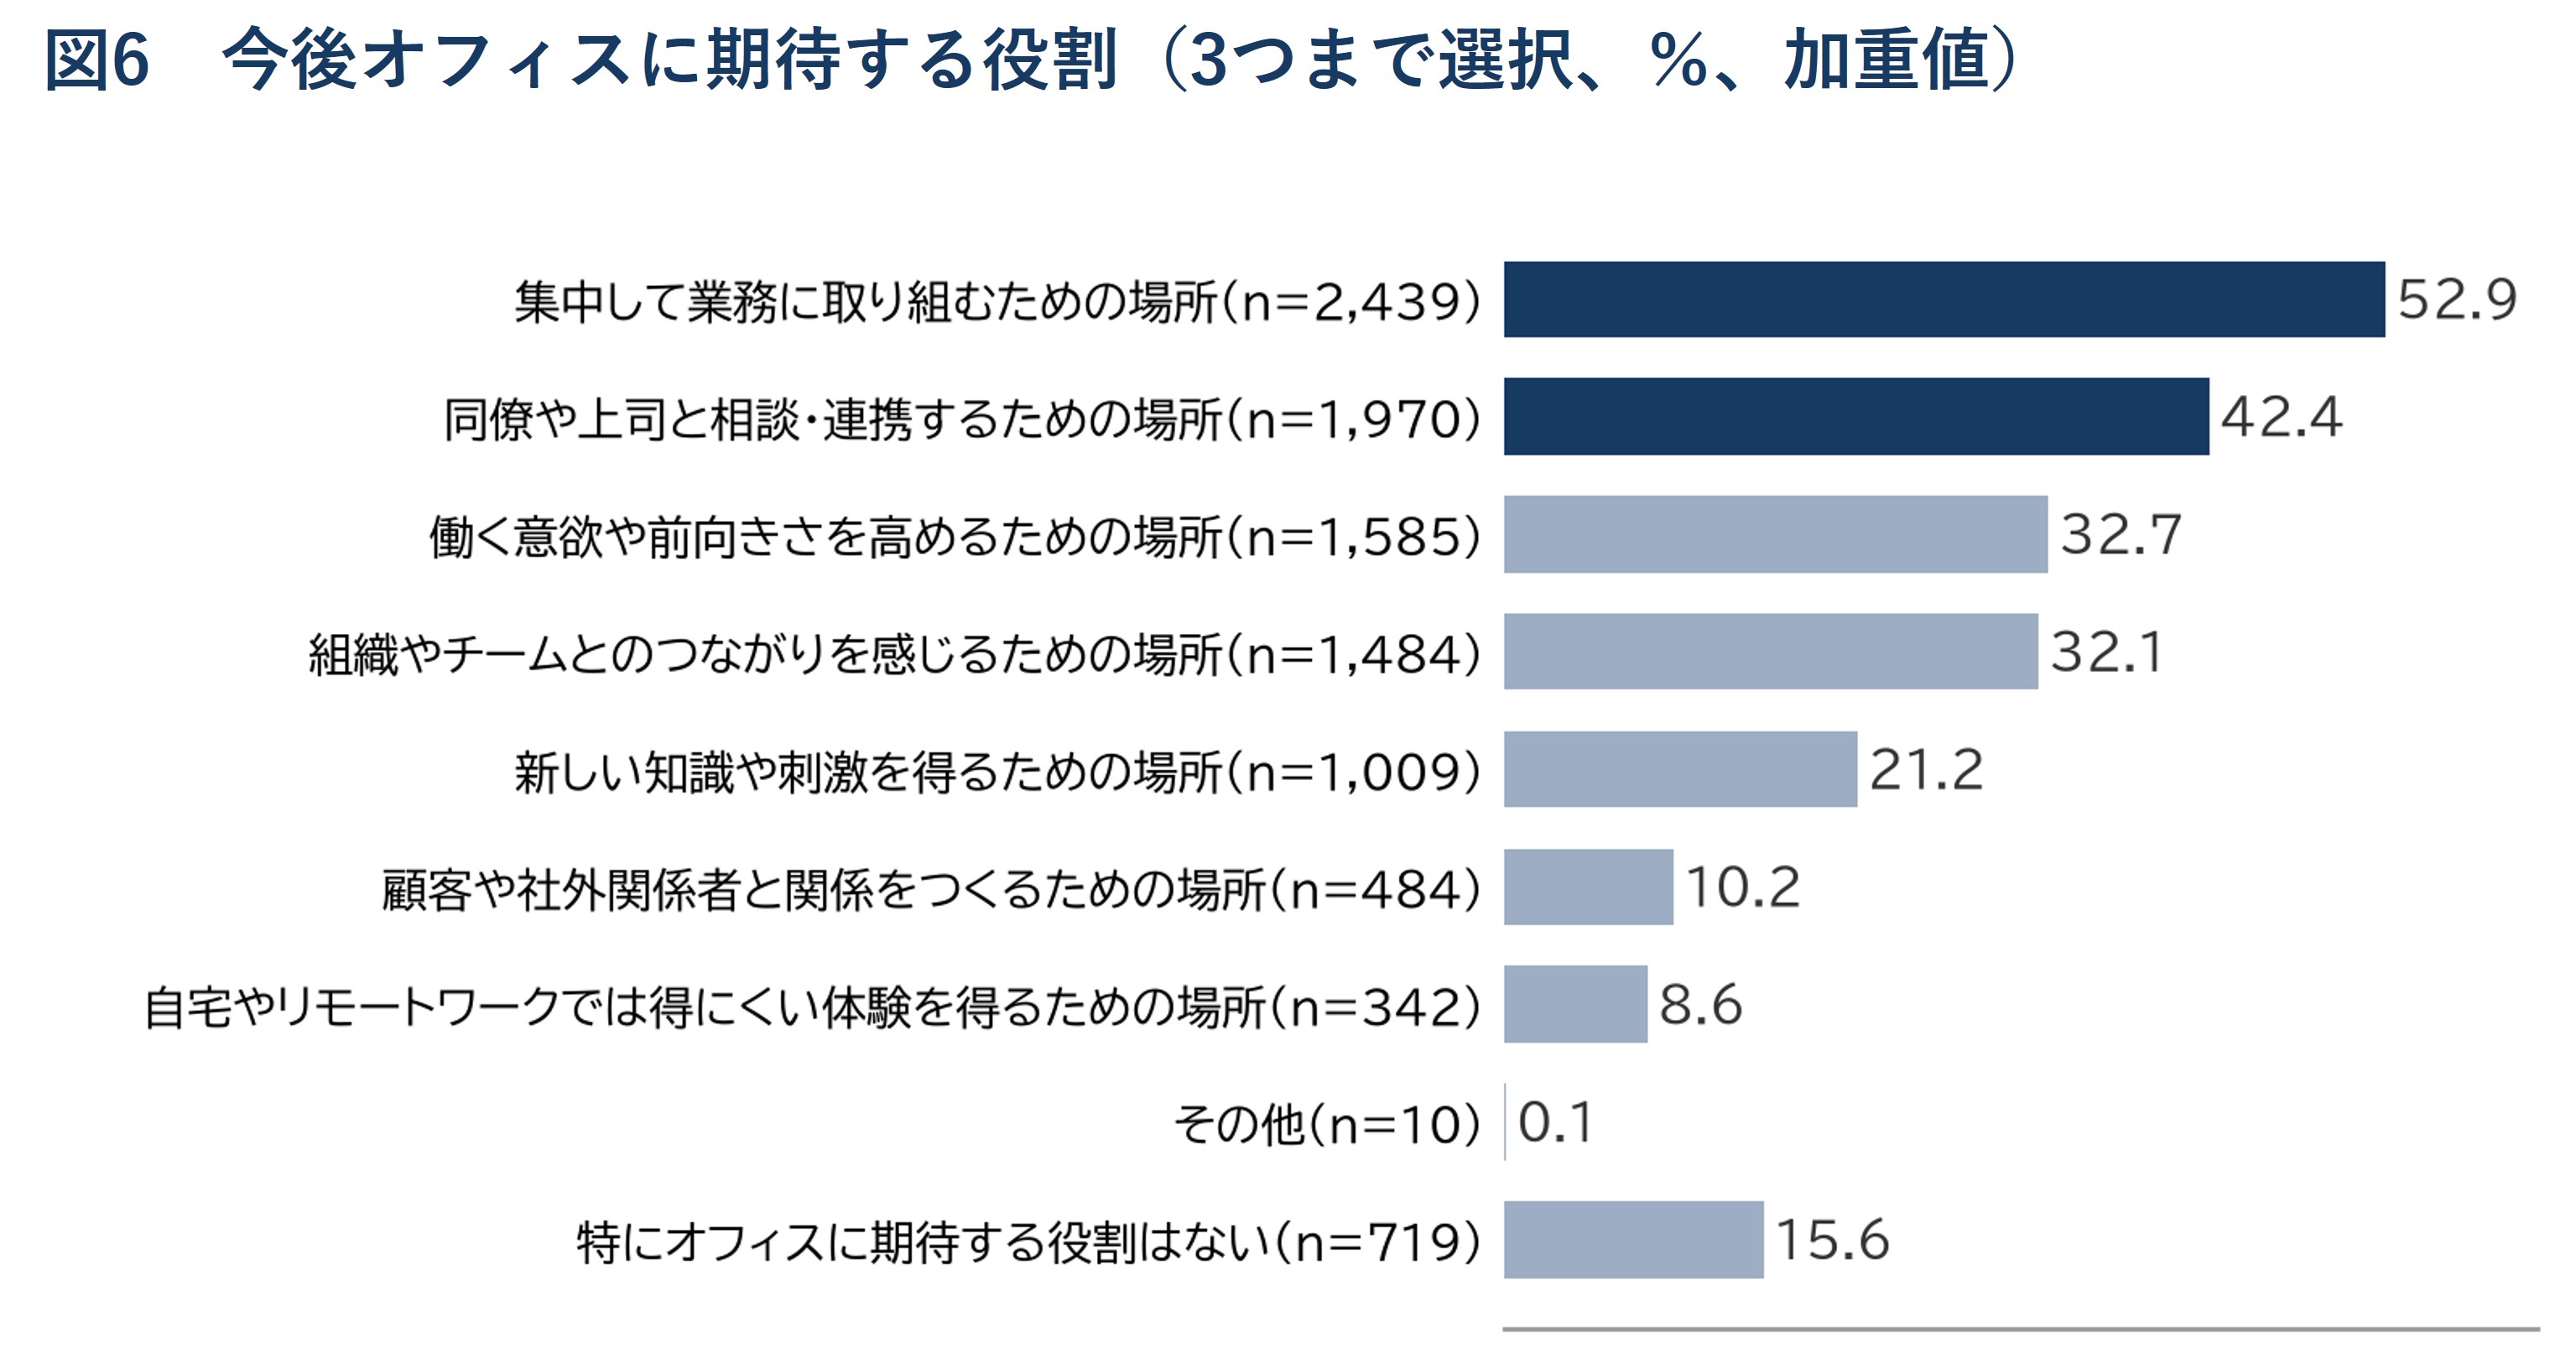
Note: Up to three options can be selected (including those who selected only one or two). The options are listed in descending order of percentage, with "Other" and "No particular role expected of the office" placed last. "No particular role expected of the office" is a standalone option. n is the number of people who selected it (before adjustment).
Source: ITOKI CORPORATION "National Office workers Awareness Survey 2026"
Looking at the results by age group, the percentage of people who cited "concentration" was 45.7% for those in their 20s, 50.5% for those in their 30s, 56.6% for those in their 40s, and 57.4% for those in their 50s, making it the most common role across all age groups (Figure 7). The difference between this and the second most common role, "consultation and collaboration," was 8.1 percentage points for those in their 20s (45.7%/37.6%) and 13.2 percentage points for those in their 50s (57.4%/44.2%), with the difference being smaller for those in their 20s. Also, those in their 20s were more likely than those in their 50s to cite "a place to gain new knowledge and inspiration" (24.0%, compared to 19.1% for those in their 50s) and "no particular role expected from the office" (17.4%, compared to 13.5% for those in their 50s), indicating a difference in expected roles. Even when comparing based on job title, years of service, company size, etc., the trend of a higher percentage of those in their 40s and 50s citing "concentration" remained unchanged.
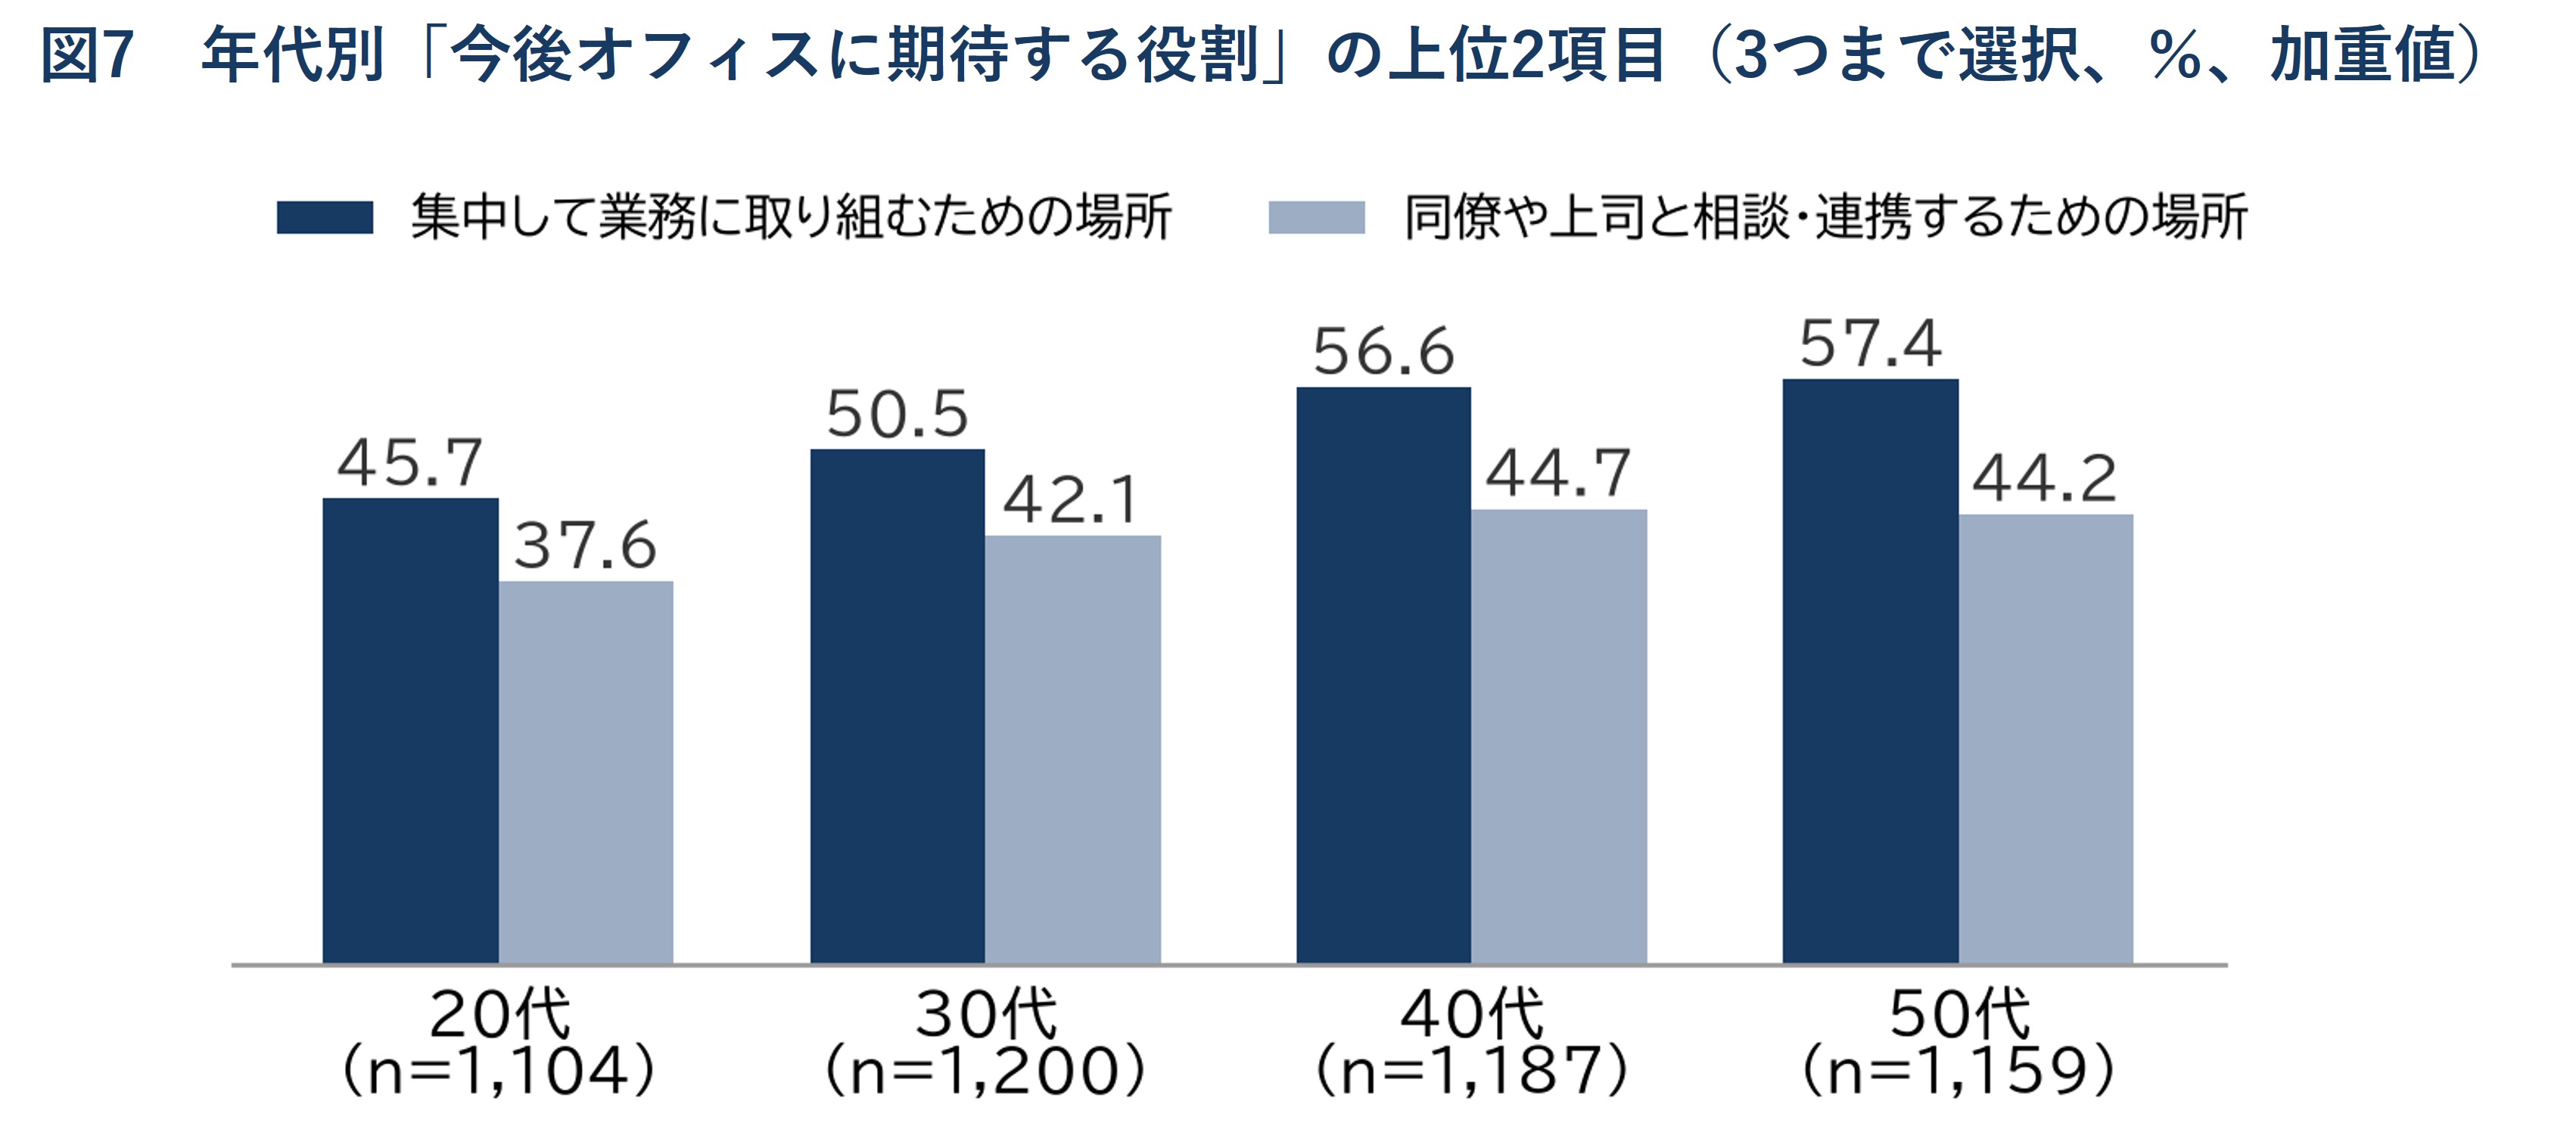
Note: All respondents (4,650 people) were compiled by age group. Percentage of those who made a selection. n is the number of respondents (before adjustment). Age differences were also observed in analyses where job title, years of service, gender, company size, region, and office role were matched (both weighted and unweighted). Unlike the age differences in feelings of loneliness (Figure 1), differences remain even when attributes are matched.
Source: ITOKI CORPORATION "National Office workers Awareness Survey 2026"
Summary: The value of an office lies in what you gain from working there.
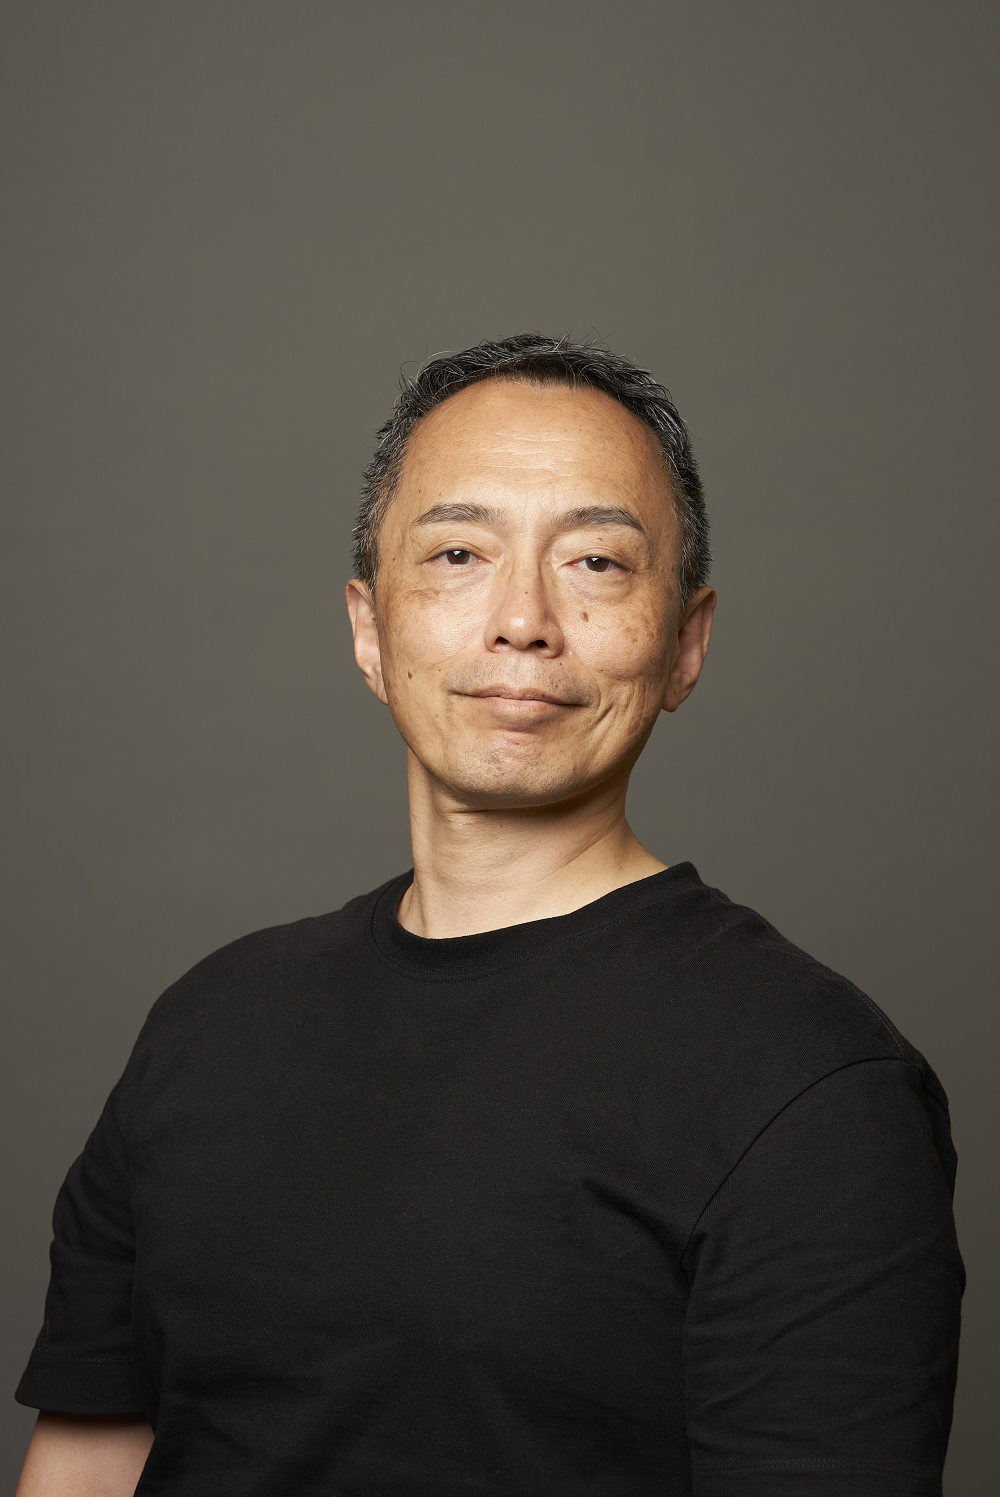
Hiroaki Ninoyu, Executive Officer, Central Research Institute ITOKI CORPORATION
Discussions surrounding attendance at the office have so far focused primarily on the number of days a week an employee comes in. However, even among those who attend the office five or more days a week, 88.4% of those who rated their work experience highly in terms of "growth and a sense of meaning" said they "want to continue working at this workplace," compared to only 13.5% of those who rated it lower. There was also a difference of more than four times in "ease of work" and "connection with the organization." We need to look beyond just the frequency of attendance and focus on the experiences gained at the workplace.
Working in the same place as others and feeling connected are not the same thing. About 20% of people in their 20s said they "can work without feeling isolated," but they also feel lonely. Furthermore, the number one role that people expect from the office, including those in their 20s, is "concentration" (45.7% of those in their 20s), and this figure rose to over 50% for those in their 40s and 50s. Perhaps it's time to re-examine the premise that a workplace functions simply by bringing people together.
I believe the value of an office in the future will not be measured by how many people come for how many days, but by whether those who come can concentrate, consult, and make progress on their work. We need to verify what people gain from working there, from both a spatial and operational perspective. The Central Research Institute aims to provide the criteria for achieving this.
▼Hiroaki Ninoyu Profile
Hiroaki Ninoyu, Executive Officer, Central Research Institute ITOKI CORPORATION
Joined Itoki in 1990. Through practical design and planning work, she has been involved in creating diverse spaces, including offices and public facilities. Starting from that experience, she expanded her field to work style research, and is currently conducting research mainly on "the relationship between office environment and corporate performance." From both practical and research perspectives, she is exploring the future of offices and work styles that support the performance of employees and organizations.
Survey overview
| Survey Name | ITOKI Central Research Institute "National Office workers Awareness Survey 2026" |
|---|---|
| subject | This refers to full-time employees aged 20-59 working for companies in eight regions across Japan, whose work is primarily office-based (excluding those whose work is primarily field-based), and who spend 70% or more of their time working in the office. |
| Investigation period | August 28 - September 2, 2026 |
| Research method | internet research |
| The number of samples | 4,650 valid responses (700 respondents who answered the same option for all evaluation questions were excluded from the 5,350 respondents). |
| Aggregation method | The regional, age, and gender composition has been weighted to match the data from the Ministry of Internal Affairs and Communications' "2022 Basic Survey on Employment Structure." |
*This survey represents individual responses at a single point in time. Statements such as "I want to continue working" and "I am working productively" are intentions and feelings, and do not reflect actual turnover rates or performance. The listed correlations do not indicate causality. The regions are based on the eight categories used in the survey and do not represent results by prefecture.
Download the research report
The results presented in this release are based on the same response data as in the survey materials.
[Survey Data] Nationwide Office workers Awareness Survey 2026 [1582KB]
About Itoki's Workplace Business
Founded in 1890, ITOKI Corporation operates under its mission statement, “We Design Tomorrow. We Design Work-Style.”
Leveraging its strength of “Tech × Design based on PEOPLE,” ITOKI supports the creation of a wide range of spaces and environments through its business areas, including the manufacturing and sales of office furniture, office space design, workplace consulting, and office data analysis services, as well as furniture for home offices and learning environments, and equipment for public and logistics facilities.
As hybrid work becomes more widespread and work styles continue to diversify, ITOKI is also expanding initiatives such as space DX solutions that enhance productivity and creativity, as well as consulting services that support optimal office operations through a hands-on, collaborative approach.
In addition, ITOKI actively collaborates with external designers and partner companies to propose new work styles and workplaces for the future.
To this release
Contact information
株式会社イトーキ
中央研究所
TEL
:
03-6910-3910
Press personnel
Contact information
株式会社イトーキ
コーポレートコミュニケーション本部
広報課
TEL:03-6910-3910
- The information posted is current at the time of publication. Please note that the information may differ from the latest information.